What Is a Good Reaction Time?
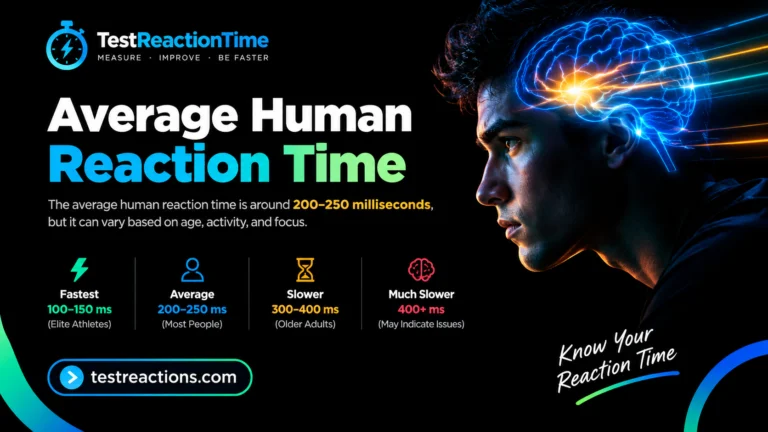
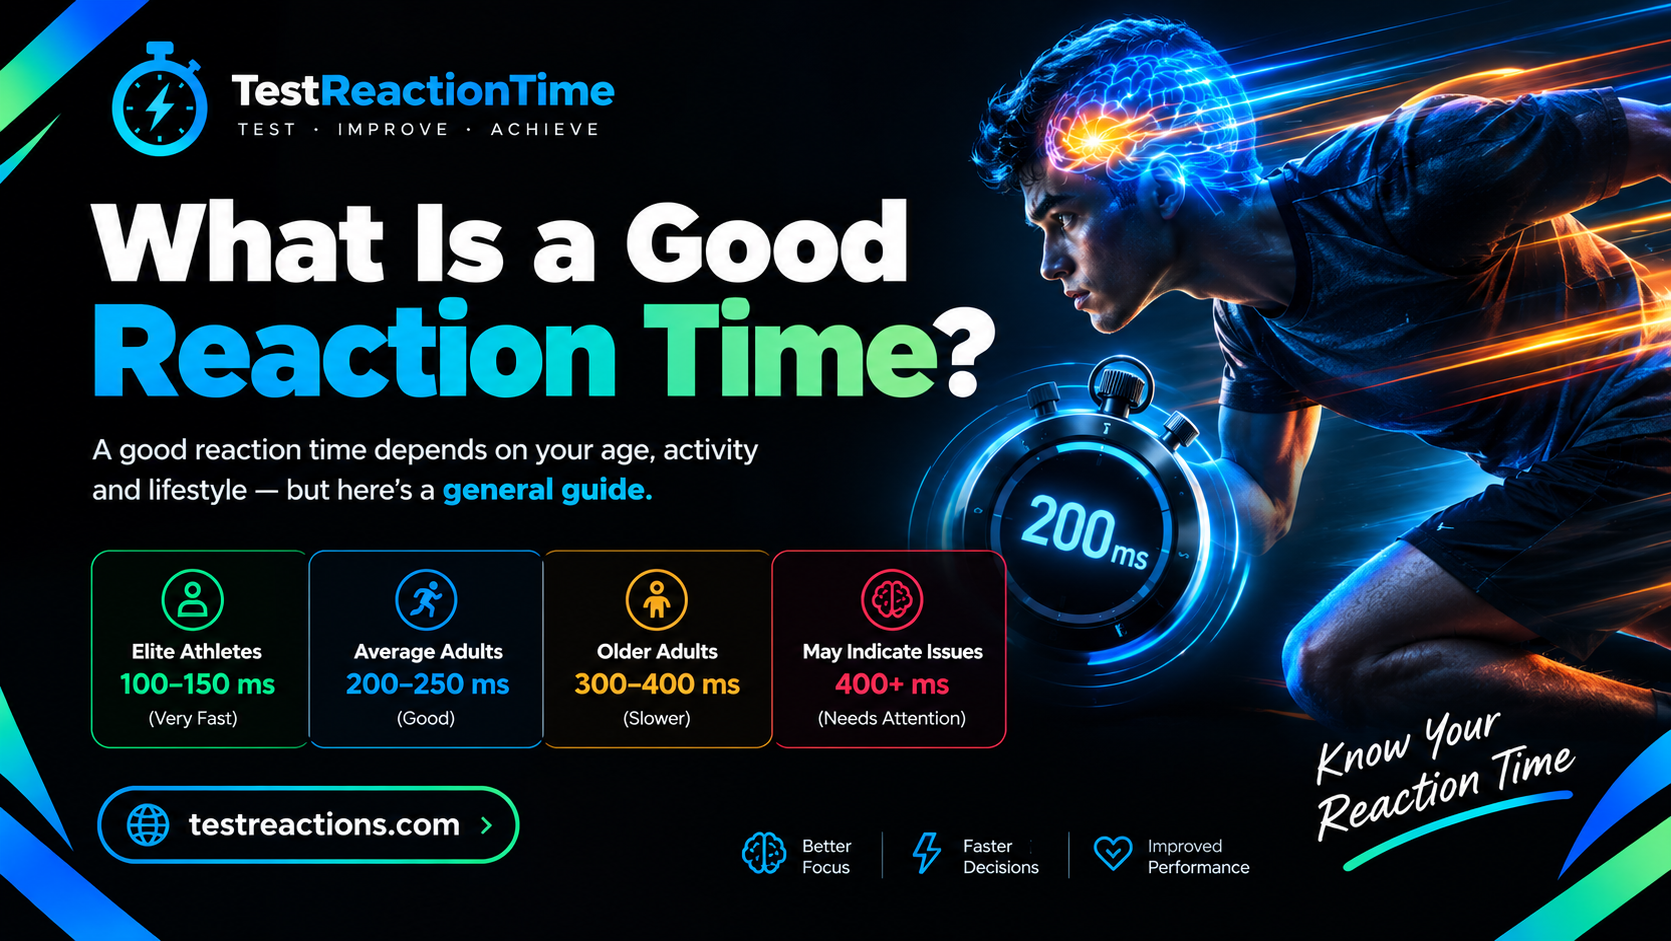
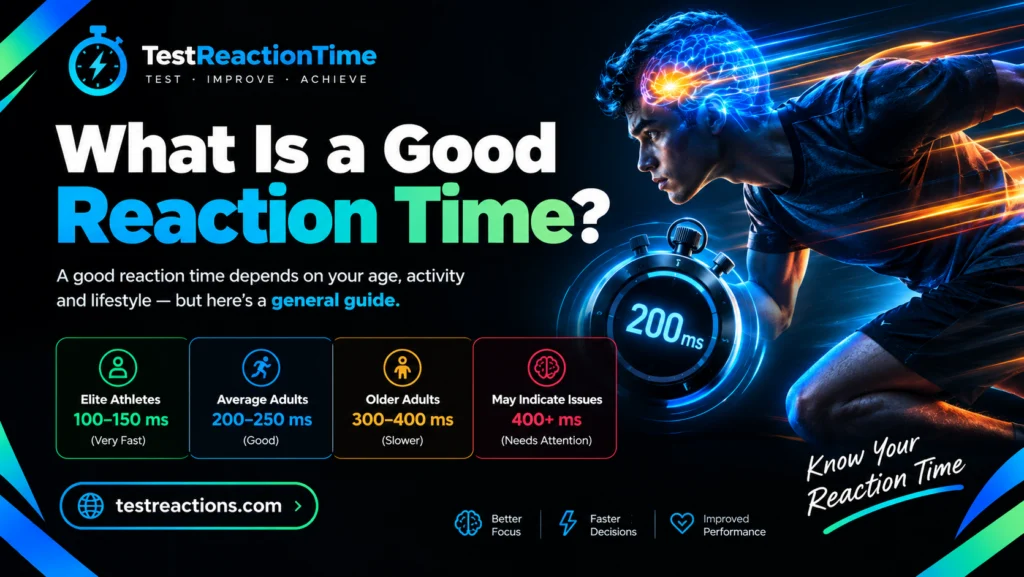
If you just ran a simple visual reaction time test and you’re wondering whether your score is actually good, here’s the quick version. Anything under 220 milliseconds is generally considered good on a typical browser based test, scores near 180 milliseconds are genuinely strong, and somewhere around 240 to 250 milliseconds sits close to the average adult result. That said, the honest answer is a little more layered than a single cutoff line, and understanding why will help you make real sense of your own number.
Why There’s No Single Magic Number
Reaction time gets measured a hundred different ways depending on the test, and that’s exactly why one person’s average score looks like another person’s exceptional score. A few things shape where the line actually falls.
The type of test matters. Visual tests, where you react to a color change or flash, run slower than auditory tests, where you react to a sound. Simple reaction tests, where there’s only one possible response, run considerably faster than choice reaction tests, where you first have to figure out which of several responses is correct.
Your hardware matters too, more than most people expect. A 60Hz monitor, a laggy touchscreen, or a cheap wireless mouse can each quietly add ten to thirty extra milliseconds on top of your actual biological reaction speed. Someone with genuinely identical reflexes could test noticeably faster or slower purely based on the device sitting in front of them.
And a single attempt just isn’t reliable on its own. Reaction time naturally bounces around from one click to the next based on focus, timing luck, and tiny shifts in attention, so a score from one lone attempt tells you far less than the average of several.
Score Bands: What Counts as Good
Here’s a practical breakdown for simple visual reaction time, the kind measured by most online tests where you click the moment a screen changes color.
| Rating | Time Range | What It Means |
|---|---|---|
| Exceptional | Under 180 ms | Rare on casual browser tests, worth confirming with a few repeat attempts |
| Very good | 180 to 220 ms | Clearly above average reflexes for a typical browser based test |
| Good | 200 to 240 ms | A strong, solid everyday result for most adults, especially as an average |
| Average | 220 to 280 ms | The most common band for adults on standard devices and browsers |
| Below average | 280 to 350 ms | Often tied to fatigue, distraction, or slower mobile hardware |
| Needs attention | Above 350 ms | Worth checking your setup, sleep, and focus before drawing conclusions |
Notice the overlap between some of these bands. That’s intentional, not a mistake. A score of 225 milliseconds and a score of 235 milliseconds aren’t meaningfully different from each other, they’re both simply sitting in the good to average territory, and treating a ten millisecond gap like a real skill difference misses the point of how noisy this measurement naturally is.
How You Compare: Percentile Breakdown
Raw milliseconds only tell part of the story. Knowing where your score actually ranks against a large pool of other test takers often paints a clearer picture than the number alone.
| Percentile | Reaction Time | What It Means |
|---|---|---|
| Top 1% | Under 155 ms | Elite, among the fastest ever recorded on casual tests |
| Top 5% | Under 175 ms | Exceptional, faster than nearly everyone tested |
| Top 10% | Under 190 ms | Very fast, clearly ahead of the general population |
| 50th percentile | 240 to 250 ms | Typical, right in the middle of the distribution |
| Bottom 25% | Over 270 ms | Slower than most, but still within a normal range |
| Bottom 10% | Over 300 ms | Notably slow, worth checking sleep, focus, and device latency |
Percentiles are especially useful for tracking your own progress. Moving from the 50th percentile up to the 70th is a genuinely meaningful jump, even if the millisecond difference between them looks small on paper.
Good Reaction Time by Test Type
A good score changes quite a bit depending on what exactly you’re being tested on, so it’s worth comparing apples to apples rather than mixing test types together.
| Test Type | Good Score | Average Score |
|---|---|---|
| Simple visual reaction | Under 220 ms | 240 to 250 ms |
| Simple auditory reaction | Under 170 ms | 190 to 210 ms |
| Choice reaction (2 to 4 options) | Under 350 ms | 400 to 500 ms |
| Tactile (touch based) reaction | Under 150 ms | 170 to 190 ms |
Auditory and tactile reactions naturally beat visual ones because sound and touch signals travel a shorter path to the parts of your brain responsible for triggering a response, while light takes a longer route through your visual cortex first. Choice reaction time runs considerably slower across the board simply because there’s an extra decision making step involved before your body ever starts moving.
How a Good Score Changes With Age
Age shifts the entire scale, gradually rather than suddenly. A 250 millisecond result might sit right in the average band for someone in their twenties, while the same exact number could land closer to above average for someone in their fifties.
| Age Range | Good Score | Average Score |
|---|---|---|
| Under 20 | Under 210 ms | 230 to 260 ms |
| 20 to 29 | Under 200 ms | 210 to 240 ms |
| 30 to 39 | Under 210 ms | 220 to 260 ms |
| 40 to 49 | Under 225 ms | 235 to 280 ms |
| 50 to 59 | Under 245 ms | 255 to 300 ms |
| 60 and above | Under 270 ms | 280 to 330 ms |
Reaction speed typically peaks in the early to mid twenties and slows gradually afterward by only a couple of milliseconds a year, a pattern backed by decades of research rather than any single dataset. If you’re comparing your own score against a friend or family member in a different age bracket, using these adjusted bands gives a far fairer comparison than a single universal cutoff.
What Counts as Good for Gamers and Athletes
If you’re testing yourself with a specific competitive goal in mind, the bar sits noticeably higher than casual browser test averages.
| Group | Typical Good Score |
|---|---|
| Casual test takers | Under 220 ms |
| Competitive gamers | Under 200 ms |
| Professional esports players | 150 to 180 ms |
| Trained athletes (general) | 160 to 210 ms |
| Fighter pilots | 150 to 170 ms |
| Formula One drivers | Near 150 ms |
| Elite documented outliers | 100 to 120 ms |
It’s worth pointing out that scores under about 100 milliseconds are often treated as physically implausible responses to a genuinely unexpected stimulus rather than real reactions, which is exactly why sprinters are flagged for a false start if they leave the blocks in under 100 milliseconds after the gun fires. A number that low usually reflects timing luck, anticipation, or a testing glitch rather than a real biological reaction.
Interestingly, the gap between competitive gamers and the general population comes down to more than raw biology. Practiced reflexes and low latency hardware, think high refresh rate monitors and wired, high polling rate mice, both play a real role in pushing measured scores down, alongside genuine improvements in visual processing built through repetition.
How to Get a Reliable Score
If you want a number you can actually trust and compare against these tables, testing correctly matters just as much as your actual reflexes.
Run three to five attempts rather than relying on a single click, and use your average rather than your single fastest result, since one lucky or anticipated click doesn’t represent your real reaction speed. Stick with the same device and browser each time you test if you’re tracking progress, since switching between a phone, a laptop, and a gaming mouse will shift your numbers around even if your actual reflexes haven’t changed at all. Testing at a similar time of day helps too, since fatigue late in the evening tends to slow reactions compared to a fresh morning attempt. And if your result looks unusually fast, faster than 150 milliseconds on a casual test, it’s worth rerunning it a few times, since an accidental early click can occasionally register as an impossibly fast score.
Frequently Asked Questions
What is a good reaction time in milliseconds?
Under 220 ms is generally considered good on a standard visual browser test, with scores near 180 ms standing out as very strong.
Is 250ms a good reaction time?
It’s right around the average adult result, solid but not exceptional, and a completely normal score for most people.
What is considered a slow reaction time?
Consistently scoring above 300 to 350 ms is generally considered slower than average and often tied to fatigue or device latency.
Does one fast attempt count as a good reaction time?
Not reliably. A single click can be lucky or anticipated, so an average of several attempts gives a far more honest picture.
Is a good reaction time the same for everyone?
No, age, test type, and even the device used all shift what counts as a genuinely good score.
What is a good reaction time for gaming?
Under 200 ms is considered strong for competitive gaming, with top professional players often testing between 150 and 180 ms.
Why does my score change every time I test?
Small shifts in focus, timing, and even device performance naturally cause your score to vary slightly between attempts.
Is auditory reaction time supposed to be faster than visual?
Yes, sound reaches the brain’s response centers faster than light does, so a good auditory score sits lower than a good visual one.
Final Words
A good reaction time isn’t really a single number you either hit or miss, it’s a range that shifts depending on how you’re being tested, how old you are, and even what device you happen to be using. The most useful thing you can do isn’t chasing one perfect click, it’s understanding roughly where you sit compared to people in similar conditions, then tracking your own average over time on the same setup. That trend line tells you far more about your actual reflexes than any single fast or slow attempt ever could.