Average Human Reaction Time: What the Real Data Actually Shows
So What Is the Average Reaction Time, Really?
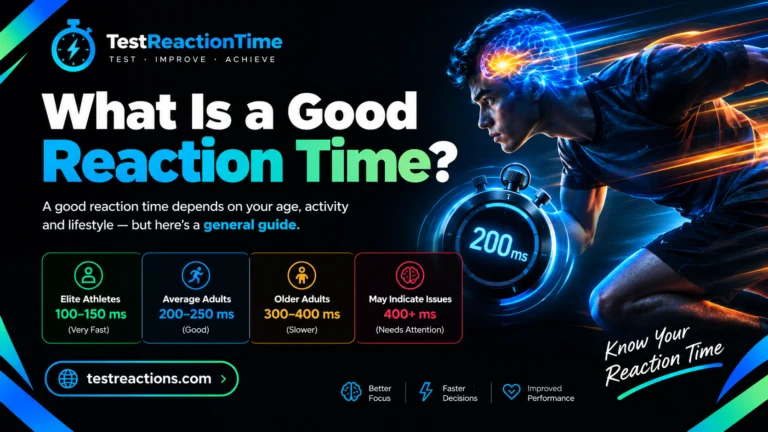
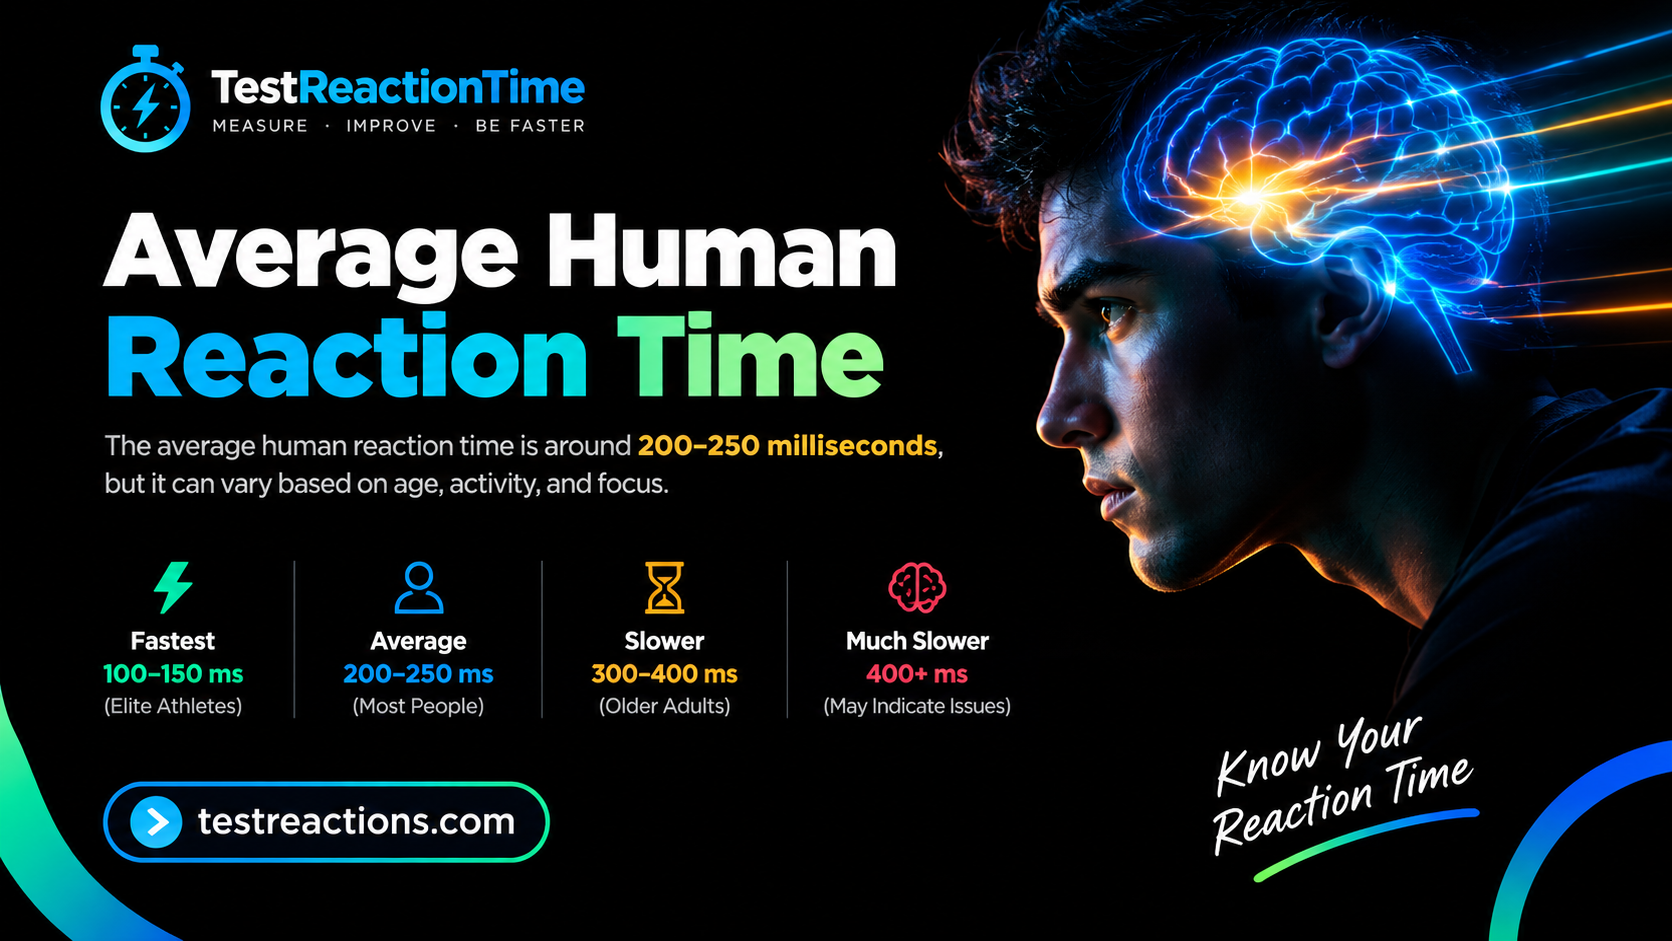
Ask this question and you’ll get a slightly different number depending on where you look, and that’s actually the most honest place to start. Based on one of the largest public datasets ever collected, over 81 million individual attempts through the popular Human Benchmark tool, the average simple visual reaction time comes out to 284 milliseconds, with a median of 273 milliseconds. Other large scale online benchmarks tend to land a little lower, often somewhere in the 240 to 250 millisecond range, while smaller controlled lab studies frequently report averages closer to 200 to 250 milliseconds for the same basic visual task.
None of these numbers are wrong. They’re just measuring slightly different things, on different devices, with different sample sizes and testing conditions. That’s the real story behind average reaction time, and it’s worth understanding before you compare your own score against any single figure.
Why There Isn’t One Universal Number
A reaction time test sounds simple on the surface. A stimulus appears, you respond, the gap gets measured in milliseconds. But that measurement bundles together several things happening in sequence: your eyes or ears detecting the stimulus, your brain processing what it means, your nervous system deciding how to respond, and your muscles physically carrying out that response. Each of those steps takes time, and small differences in any of them shift your final number.
On top of that biological variability, online tests add their own layer of noise. Your monitor’s refresh rate, your mouse or touchscreen’s latency, your browser’s rendering speed, and your internet connection can each tack on anywhere from a few milliseconds to over fifty. A 60Hz monitor, for example, only refreshes the screen sixty times per second, which means there’s a built in delay before the color change you’re reacting to is even visible. That’s a big part of why online averages tend to run a bit higher than tightly controlled laboratory numbers.
Average Reaction Time by Stimulus Type
Not every reaction is created equal. How you’re asked to respond, whether to something you see, hear, or feel, changes your average significantly.
| Stimulus Type | Typical Average |
|---|---|
| Visual (light, color change, movement) | 200 to 250 ms |
| Auditory (sound or beep) | Around 170 ms |
| Tactile (touch or vibration) | Around 150 ms |
Sound and touch consistently beat vision, and the reason comes down to basic anatomy rather than practice. An auditory signal reaches the parts of your brain responsible for triggering a response in as little as eight to ten milliseconds, while a visual signal takes a noticeably longer route through your visual cortex before your brain can act on it. This is exactly why a beep tends to get a faster reaction than an equally sudden flash of light, even when everything else about the test is identical.
Simple vs Choice Reaction Time
There’s another distinction that changes the average dramatically: whether you’re reacting to one known signal or having to choose between multiple possible responses.
Simple reaction time measures how fast you respond to a single, expected stimulus with a single response, like clicking the moment a screen turns green. This is what most basic online tests measure, and it’s where the 200 to 300 millisecond averages mentioned above come from.
Choice reaction time asks you to first identify what you’re seeing or hearing, then select the correct response from multiple options. This extra decision making step slows things down considerably. Research measuring choice reaction tasks has found average times well over 400 milliseconds, sometimes climbing past 500 milliseconds depending on how many choices are involved and how complex the task is.
If you’re comparing your own score against an “average reaction time” figure you found online, it’s worth checking which type of test produced that number, since simple and choice reaction times really aren’t comparable to each other.
Average Reaction Time by Age
Age remains one of the most consistent factors influencing reaction speed, and the pattern shows up again and again across both academic research and large scale public datasets.
| Age Range | Average Visual RT | Typical Range |
|---|---|---|
| 10 to 14 | ~285 ms | 240 to 330 ms |
| 15 to 19 | ~240 ms | 200 to 290 ms |
| 20 to 24 | ~210 ms | 170 to 260 ms |
| 25 to 29 | ~215 ms | 175 to 265 ms |
| 30 to 39 | ~225 ms | 185 to 275 ms |
| 40 to 49 | ~240 ms | 200 to 290 ms |
| 50 to 59 | ~260 ms | 215 to 315 ms |
| 60 and above | ~285 ms | 240 to 350 ms |
Reaction speed tends to improve steadily through childhood, reaches its fastest point somewhere in the early to mid twenties, holds fairly stable through the thirties, and then gradually slows from the forties onward. This lines up with what’s known about nerve conduction, which naturally slows a little with age, and it’s a well documented pattern rather than something unique to any one dataset or test.
How Trained Groups Compare
General population averages only tell part of the story. Groups who train reaction speed as part of their profession or sport post noticeably faster numbers than the typical person taking a casual online test.
Professional athletes across various sports have been measured with average reaction times between 160 and 210 milliseconds, meaningfully faster than the general population’s 200 to 300 millisecond range. At the far end of the spectrum, fighter pilots, Formula One drivers, and top level competitive video game players have been clocked in the 100 to 120 millisecond range, among the fastest documented human reaction speeds outside of pure statistical outliers.
It’s worth noting that a reaction under 100 milliseconds is often considered physically implausible as a genuine response to a stimulus rather than anticipation. This is exactly why sprinters are disqualified for a false start if they react in under 100 milliseconds after the gun, since that’s faster than the human nervous system can genuinely process and respond to a completely unexpected signal.
Lab Testing vs Online Testing
It’s worth being upfront about a real limitation here. Laboratory studies control for lighting, seating position, exact stimulus timing, and standardized response equipment, which produces clean, tightly grouped data. Online reaction time tests run on whatever device you happen to have, through a general purpose browser, with all the small inconsistencies that come with that setup.
This doesn’t make online testing useless, far from it. It’s genuinely useful for tracking your own progress over time and comparing yourself against a large pool of other online testers using similar conditions. What it isn’t is a substitute for a clinical or laboratory measurement, and treating a browser based score as medically precise would be a mistake. The most reliable way to use an online test is to stick with the same device each time and focus on your personal trend rather than chasing an exact number that matches a study you read somewhere.
What Actually Moves Your Personal Average
If your own results seem to bounce around a lot between attempts, that’s completely normal, and a handful of factors explain most of the variation.
Device and hardware. A higher refresh rate monitor, a wired mouse with a high polling rate, and a modern browser all shave real milliseconds off your recorded score compared to older or budget equipment.
Sleep. Poor sleep is one of the most well documented factors that slows reaction speed, sometimes to a degree comparable with mild impairment.
Warm up and practice. Your very first attempt on any given day is often slower than your third or fourth, simply because you haven’t settled into the task yet.
Caffeine and alertness. Moderate caffeine intake can genuinely sharpen your reaction speed, though too much tends to backfire through jitters that hurt fine motor control.
Distraction and fatigue. Divided attention slows almost every measurable reaction, which is part of why real world tasks like driving carry extra risk when you’re tired or distracted.
Because so many of these factors shift your score from session to session, taking three to five attempts and using your average rather than your single best or worst result gives a far more honest picture of where you actually stand.
Frequently Asked Questions
What is the average human reaction time?
Large scale online data puts the average simple visual reaction time around 270 to 285 milliseconds, while smaller controlled lab studies often report a somewhat faster 200 to 250 millisecond average for the same basic task.
Is 200 milliseconds a good reaction time?
Yes, 200 milliseconds is considered fast for a simple visual reaction and sits comfortably above average for most adults, though it isn’t unusual among people who game or train reaction speed regularly.
What is the fastest human reaction time ever recorded?
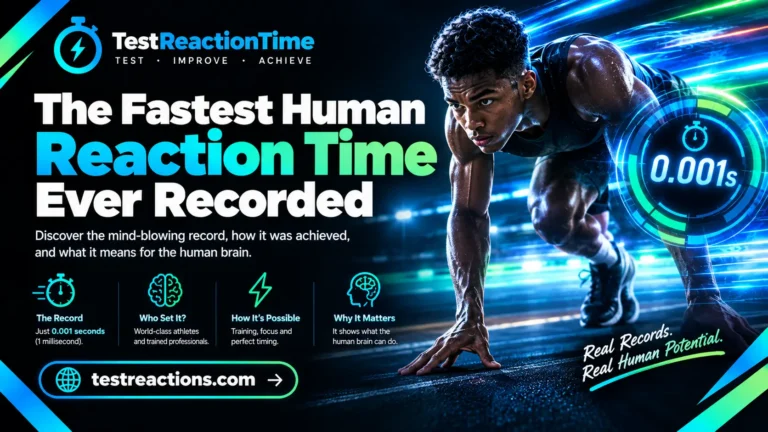
Elite groups such as fighter pilots, Formula One drivers, and top competitive gamers have been measured as low as 100 to 120 milliseconds, which is near the physical limit of what the human nervous system can genuinely achieve in response to an unexpected stimulus.
Why is auditory reaction time faster than visual?
Sound reaches the brain’s response centers through a shorter neural pathway than light does, giving auditory signals a head start of roughly thirty to fifty milliseconds over visual ones.
Does reaction time get worse with age?
Yes, though gradually. Reaction speed typically peaks in the early to mid twenties and slows by only a few milliseconds per year afterward, with a more noticeable difference appearing after age fifty or sixty.
Why do online reaction time tests give different results than research studies?
Online tests run through everyday browsers and devices, which introduce extra hardware and software latency that controlled lab equipment eliminates. Both are useful, but they’re measuring slightly different things and shouldn’t be directly compared.
How many times should I test myself for an accurate average?
Three to five attempts is generally enough to smooth out the natural noise from a single lucky or unlucky click, giving you a more reliable personal baseline to track over time.
Where This Data Comes From
The figures in this article draw on a mix of large scale public testing data, including datasets built from tens of millions of individual online attempts, alongside peer reviewed research on simple and choice reaction time, auditory versus visual processing, and age related changes in nerve conduction speed. Where ranges are given rather than single numbers, that reflects genuine variation across studies and testing methods rather than any single definitive figure.
Final Words
There’s no single magic number that represents “the” average reaction time, and that’s honestly a more useful thing to understand than any individual figure could be. What matters far more than matching a specific millisecond target is knowing roughly where you fall relative to your age group, understanding what’s actually influencing your score session to session, and tracking your own trend over time on the same setup. Take the test a few times, average your results, and use that as your real personal baseline going forward.